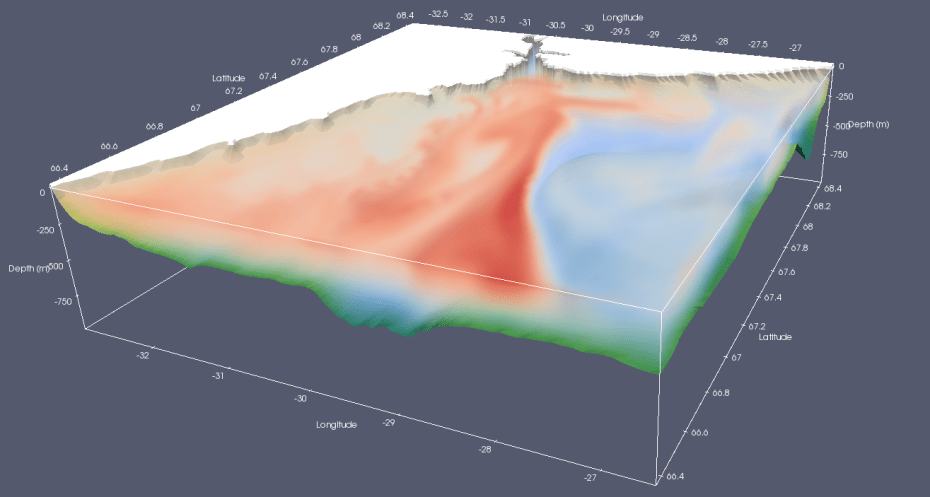
This is a project that Neil Fraser at SAMS and myself have played with on and off for a while. Neil created a hydrodynamic model of Kangerdlugssuaq Fjord in south-east Greenland using MITgcm to investigate how local wind events impact the transport of warm water into the fjord as part of his PhD. While the fjord itself was not subjected to wind stress due to assumed ice cover, a wind event on the continental shelf was theorised to set up waves in the pycnocline which could increase exchange between the fjord and the outer shelf.
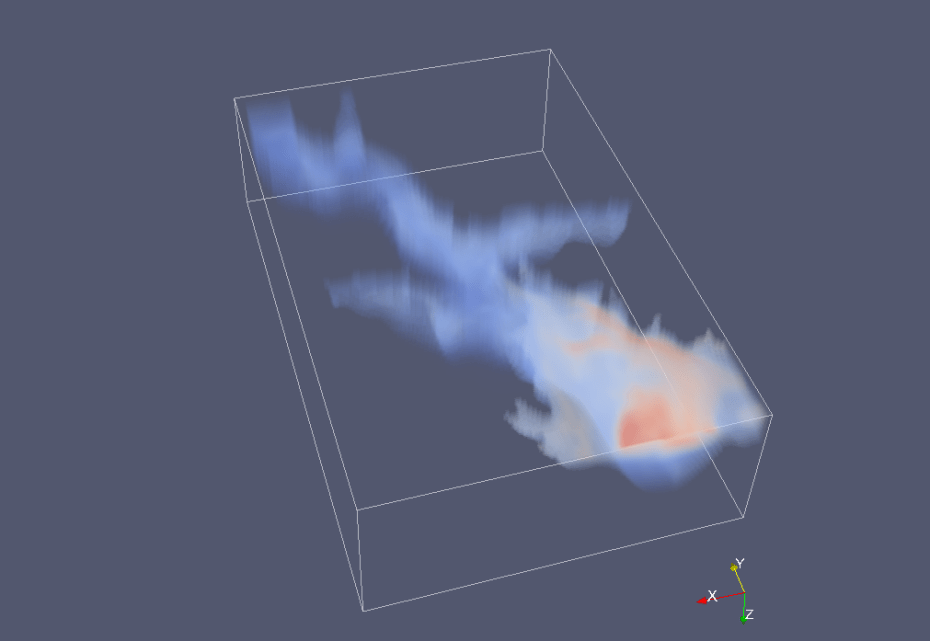
This turned out to be a classic 4D problem as the pycnocline depth and structures in the water column interacted in a complex way throughout the model volume. I therefore suggested that we attempt to visualise it in Paraview, and get a better insight into what was going on within the fjord.
As might be expected we had some fun getting the data into Paraview in the first instance, clogging both our machines up with numerous 20 Gb NetCDF files until we acheived a workable format. For future reference the direction of the z axis turns out to be critically important for the correct functioning of Paraview. Neil had several model runs forced by different wind scenarios, and one of the challenges was demonstrating the difference between them in a visually meaningful way.
Paraview undoubtedly allows the generation of beautiful and complex imagery, but its features should be used sparingly. I’m finding that while it’s often tempting to throw all sorts of fancy visualisations into an animation, that can prove distracting and not add much to the interpretation. For the current iteration I’ve only used a handful of filters:
- ‘Threshold’ to separate the model volume from surrounding NaNs (they otherwise appear as a solid block of colour)
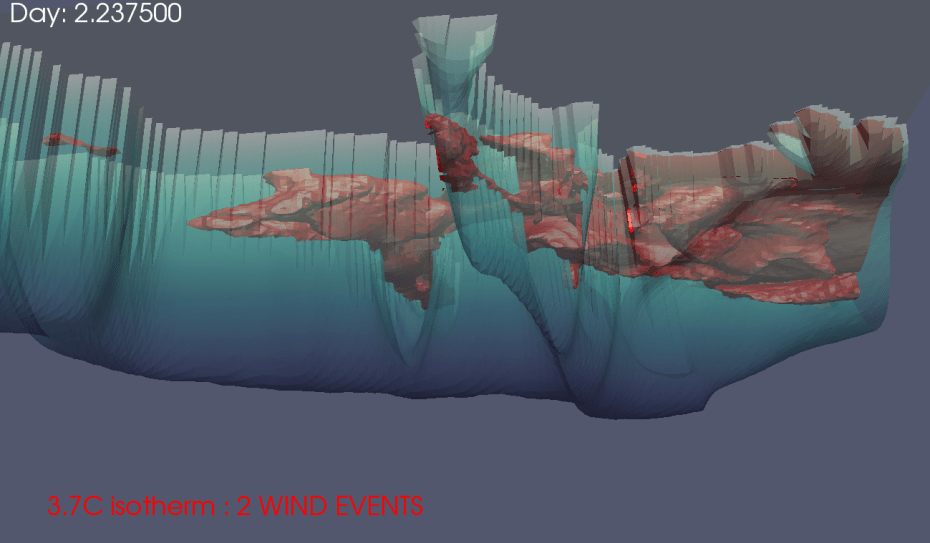
- ‘Clip’ which allows me to ‘roll back’ the model volume to reveal the inner workings
- ‘Isovolume’ generates the solid temperature isosurfaces. I coloured them with a simple temperature scale so you can see what’s going on
- ‘Isovolume’ or ‘Contour’ both result in a similar depiction of the density surface. I ramped up its reflectivity so you can see the waves in it
- A few other housekeeping filters – ‘Temporal interpolator’ as Neil’s model only runs for 480 timesteps and I wanted more frames than that. ‘Warp by scalar’ extrudes a 2D image into 3D bathymetry.

The version currently displayed is best viewed as a first draft for a short film aimed at a general audience. We’re currently working on a more scientifically informative version to act as a multimedia addition to a publication. For the paper, we hope to identify and partition the model volume using known T, S and Sigma definitions for water masses, and so provide some insight into how these interact under wind forcing scenarios.
