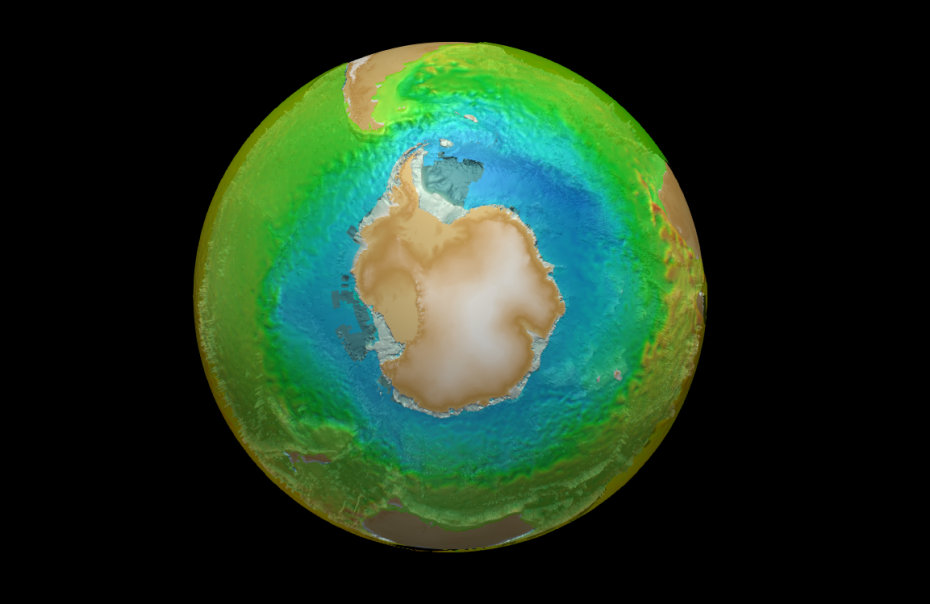
A continuation from the GEBCO bathymetry animation exercise; I wanted to experiment with rendering time-dependent global data and an AVISO altimetry dataset seemed appropriate. This is a large gridded (x,y,time) dataset and is relatively simple to load into Paraview. I manipulated it in the same manner as the bathymetry data, distorting the plotted surface vertically using the Sea Surface Height (SSH) anomaly data. In reality, the SSH varies by roughly +/- 1 metre, so in order for it to be visible in a global context I exaggerated this by 50,000. This results in a ~100 km vertical deflection, which is enough to cast shadows but is not visually too distracting.
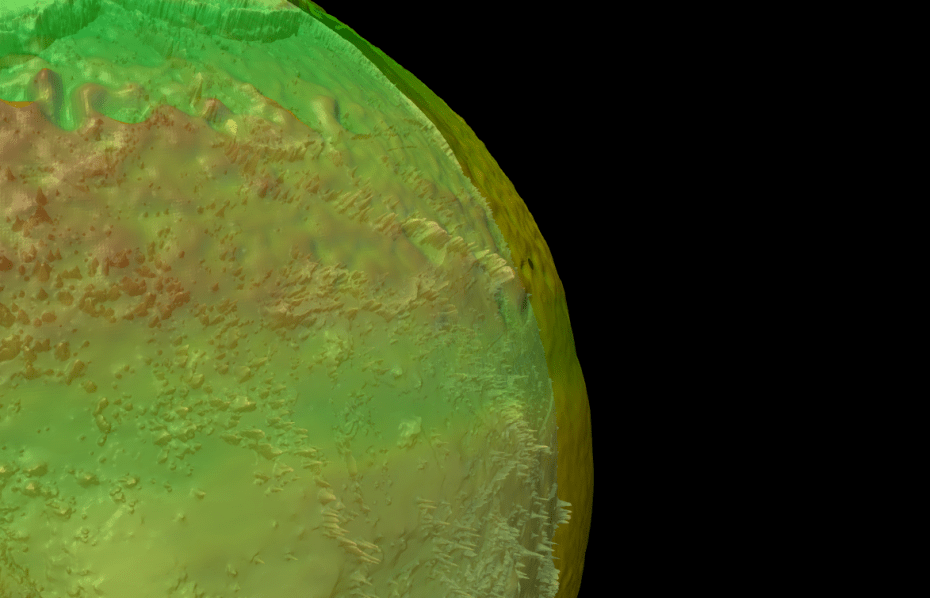
The SSH data is partially transparent to try to show the underlying bathymetry, though not sure this is particularly obvious. As the SSH data has a much greater exaggeration (x 50,000) than the bathy data (x 50), this leads to some interesting interactions near the coast, and I had to do a bit of experimenting to stop the sea surface dipping beneath the seabed in shallow waters.