A series of animations exploring the behaviour of the Loch Etive FVCOM model. The aim was to give a visual introduction to the model architecture before introducing the dye release experiment here.
Above: the temperature and salinity are plotted over a tidal cycle for the full 3D volume.
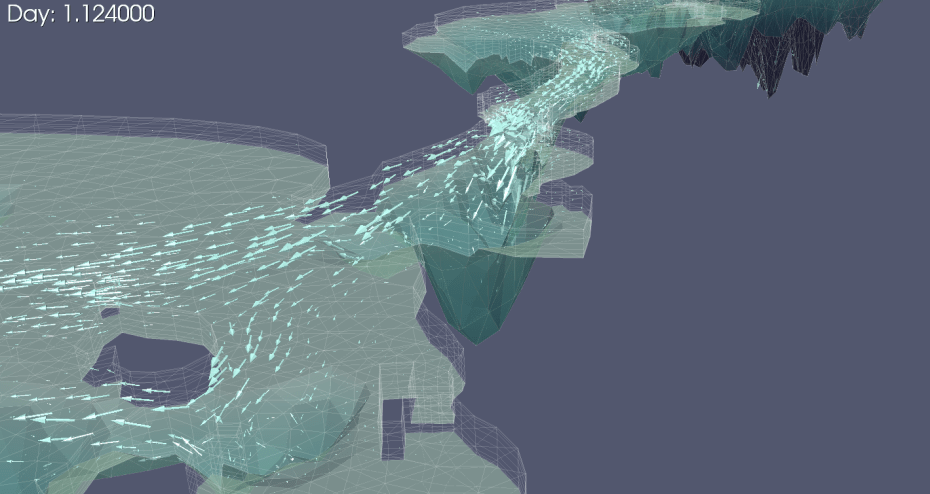
Salinity thresholds (here only plotting water with a salinity over a certain value). This can sometimes help to see the evolution of the water structure in 3D as a ‘slug’ of water moves in response to the tides. Shown are two narrow straits in Loch Etive; Bonawe Narrows and the Falls of Lora.
Adding local topography and Google imagery to the model for context. Getting all this lined up in 3D space is easier said than done as thye all use different coordinate systems!

Modelling: Dr Dmitry Aleynik.
