oceanographer, photographer, artist based in Argyll, Scotland
High-resolution spatial analyses using glider data (and other high-res measurement campaigns)
This study was designed to complement the spatial analyses I conducted as part of the ODaT project (see details here) and later as part of MASSMO. Several new data products were computed from historical data, but it was recognised that the occupation of a region by a glider would increase the data density by several orders of magnitude, thus providing new information on oceanographic features.
I initially wrote a series of scripts to accept glider data and calculate measures of stratification and water properties which could then be compared to regional climatology.
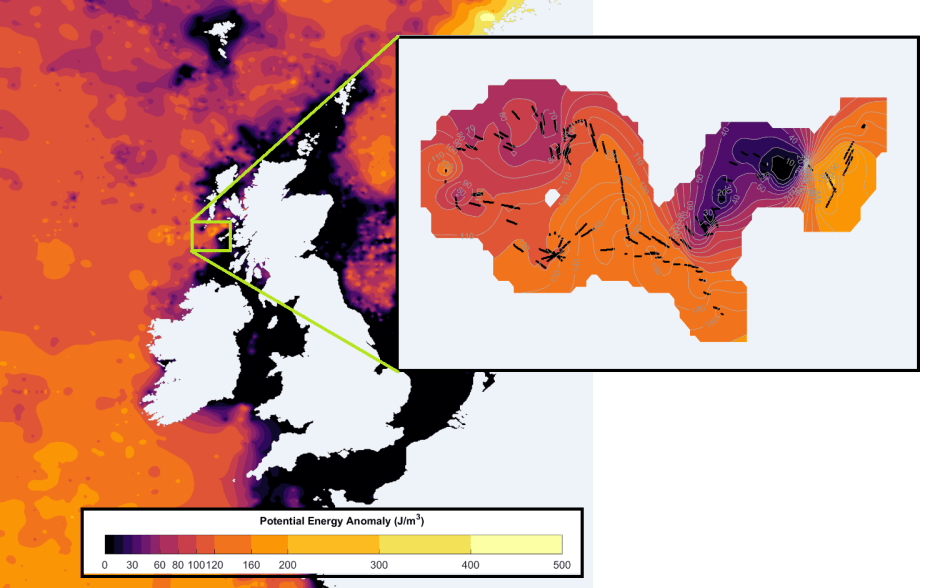
Comparison between stratification strength computed for September using historical data (main panel) and a single glider mission.
I’ve continued to develop these data products, with further iterations incorporating the ability to assess the change in strength and depth of stratification in time as well as space. This means that we can infer the impact of internal wave activity on the region sampled by the gliders, for example. Below are a series of figures from the MASSMO-4 exercise in the Faroe-Shetland Channel in summer 2017.
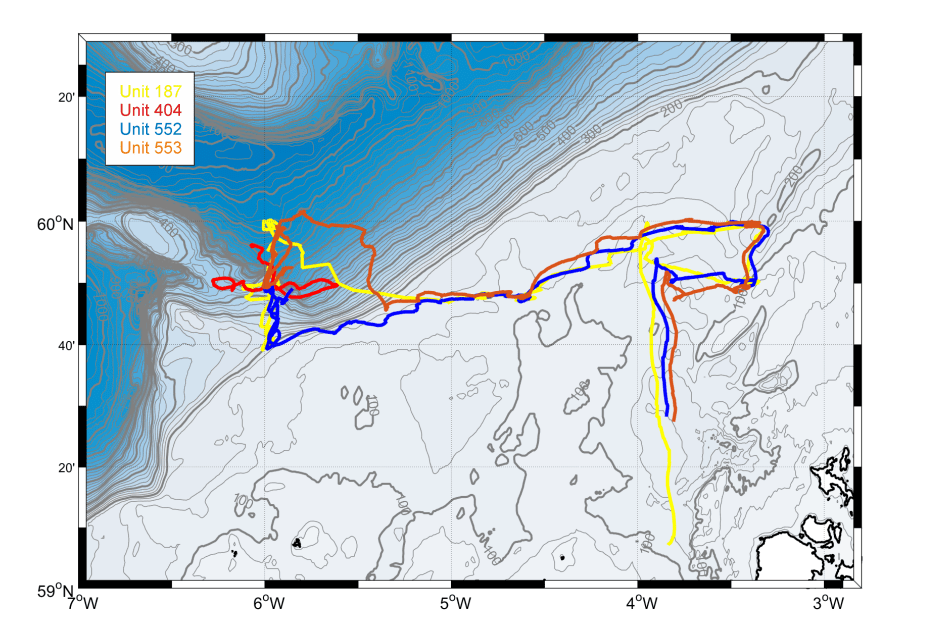
Tracks of gliders deployed during MASSMO-4 experiment
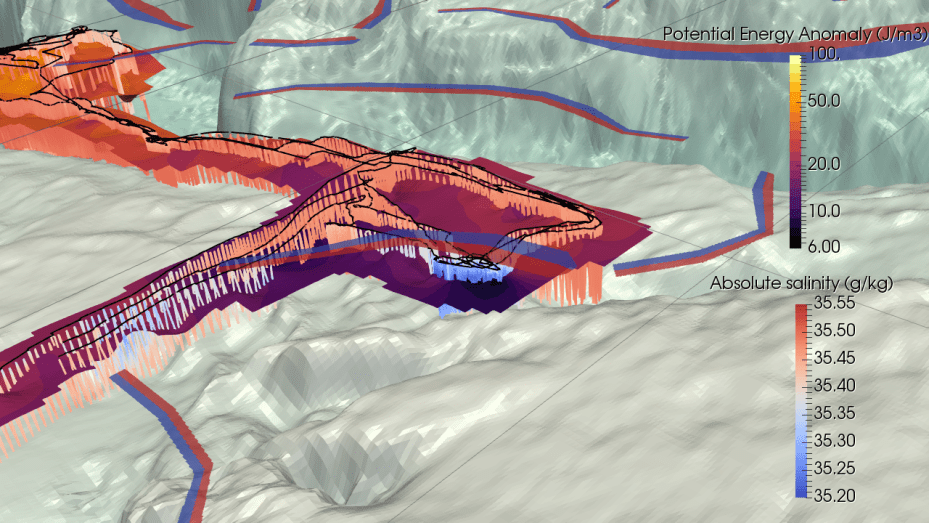
3D oblique view showing salinity from glider observations. Intersecting surface is the pycnocline (density stratification) depth as diagnosed from the gliders. The surface is coloured by the Potential Energy Anomaly, or the strength of water column stratification. Broad red/blue bands are the surface position of thermal fronts computed from satellite data (PML).
a) Example glider dataset from MASMSO-4, plotted by time and depth, data shown is density, and the depth of maximum stratification is highlighted by a black line. Solid black shows seabed. b) A temporal filter applied to stratification depth, to attempt to isolate spatial changes (caused by the glider’s movement) and temporal changes (vertical movement over time). c) Anomaly from the filtered depth, and an inferred internal wave amplitude plotted over time. See below for the same data plotted over space.a) Estimated internal wave amplitude observed by gliders in the Faroe-Shetland Channel; see previous figure for the same data plotted over time. b) Expected sources of internal waves due to tidal (M2) activity in the Faroe-Shetland Channel in AMM-60 model (Guihou et al., 2018).
This work was carried out in collaboration with DSTL.
Guihou, K., Polton, J., Harle, J., Wakelin, S., O’Dea, E. and Holt, J., 2018. Kilometric scale modeling of the North West European shelf seas: exploring the spatial and temporal variability of internal tides. Journal of Geophysical Research: Oceans, 123(1), pp.688-707.