One of the aims of the ODaT project was to generate ‘value added’ data products from existing raw historical data. In collaboration with DSTL, I investigated methods for characterising stratification using both modelled and observational datasets. These products will be distributed on the SAMS geodata server and updated dynamically as new data becomes available.

Several parameters were deemed to be of interest:
- The depth of stratification (if any) – observed climatology
- The strength of stratification – observed climatology
- Likelihood of stratification for a given area – modelled
- Regions of internal wave generation – modelled
- Magnitude of internal waves – observed, from gliders
Historical data were managed using Hydrobase; a powerful tool for climatological analysis of observational data. Where more advanced surface fitting schemes were required, the spline under tension approach (Smith and Wessel 1990) was employed.
One of the aims of the project was to compare high resolution glider data with historical data; information on that work is provided here.
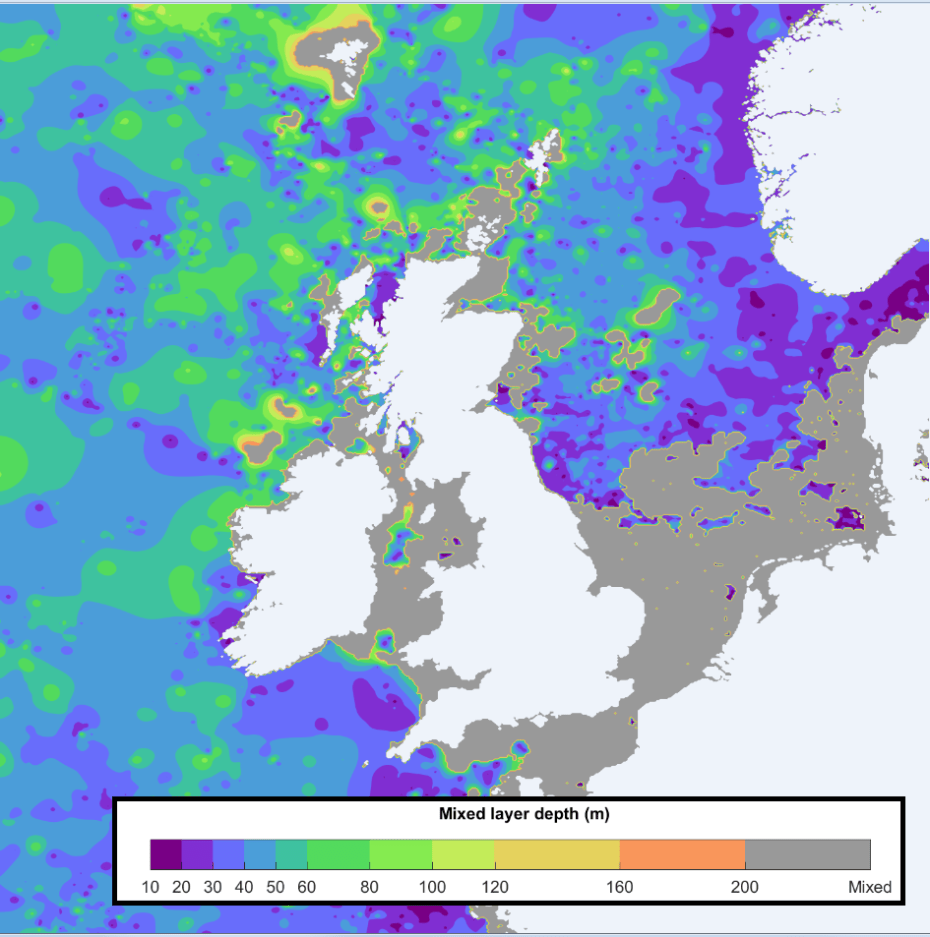
Depth of Stratification
To quantify the depth of stratification using observed data, two different approaches were used. Glider data are very high resolution and are typically of a high quality, so the pycnocline can be detected most effectively using the location of maximum buoyancy frequency (N). The buoyancy frequency is the frequency a theoretical parcel of fluid would oscillate at if it was vertically displaced from its equilibrium location. In relatively well-mixed regions of the water column the rectification force on a parcel of water is minimal as the buoyancy changes only gradually with depth, hence the buoyancy frequency is low. In a very stratified region such as the pycnocline, even a small vertical displacement results in a strong rectification force and hence a high N. Here, N is calculated using

Where g is acceleration due to gravity, ρref is the reference density, δσθ is the change in potential density and δz the change in depth.

While this method works well for glider data, for historical data it generates many mis-diagnoses. This is due both to the sparsity of observations and the poor quality of salinity measurements in earlier campaigns. Instead, it was found that the Delta T method was more robust (de Boyer Montégut et al. 2004). In the surface mixed layer the salinity, temperature and density are almost uniform, and this approach assumes that where a physical property significantly deviates from that at the surface marks the bottom of the mixed layer.
The stratification depth was computed for each profile in the database, for each month, to construct a climatology. Surfaces were fitted to complete the data product. The surface fitting technique was designed to preserve information at all scales so no smoothing was attempted. This results in the surface being pulled vertically by individual observations, but this was regarded as an acceptable trade-off.
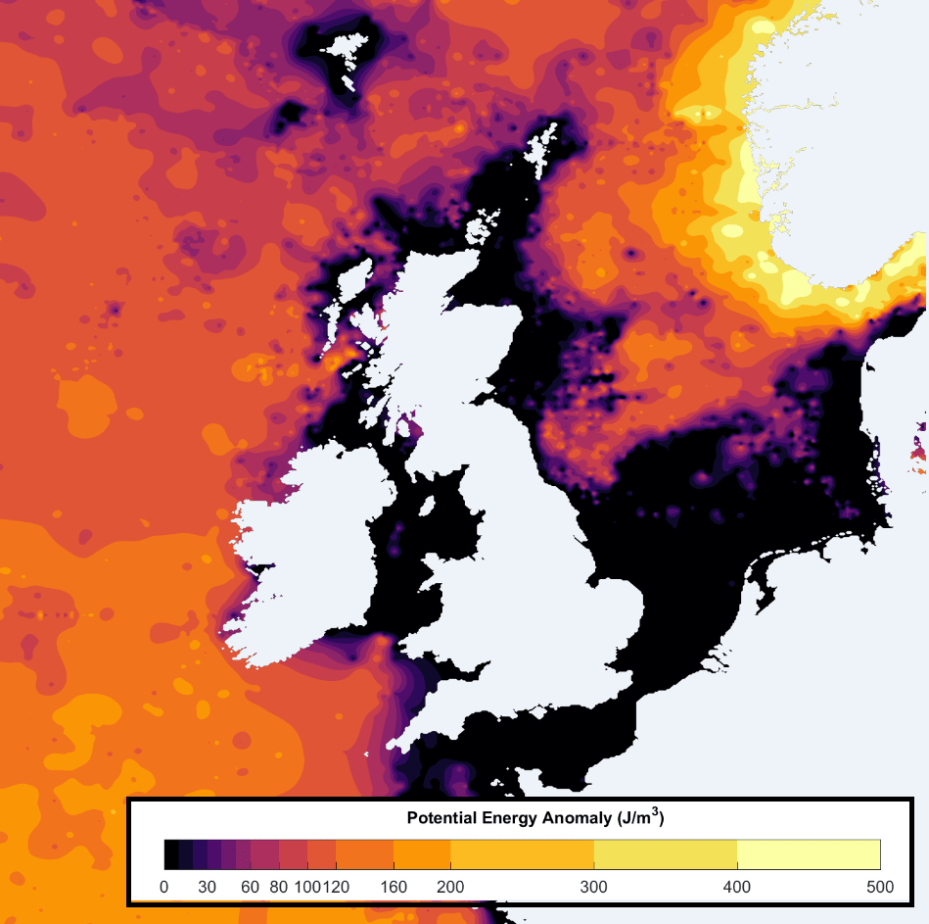
Strength of Stratification
Potential Energy Anomaly (PEA) is a quantitative measure of the strength of stratification (the amount of work required to completely mix the water column). PEA is zero (0) for a fully mixed (homogeneous) water column and becomes increasingly positive as stratification increases. Its calculation here employs the approach of Simpson et al. 1990:

Where g is acceleration due to gravity, h water depth and ρ the density. A potential source of error results from the limited sampling depth of the gliders which are not able to sample the whole water column whereas historical CTD casts typically profile to the seabed. As the PEA is an integral quantity this would result in an incorrect comparison between the two in deep water. To account for this, only the top 200 m of the water column was used for the PEA calculation.
Modelled parameters
Data from the NEMO model provided by Dr. Matt Toberman enabled me to generate several additional modelled products focusing on regional stratification. Shown here are data from the Celtic Sea only; a wider area will be added when it becomes available.


References
de Boyer Montégut, Clément, et al., 2004. Mixed layer depth over the global ocean: An examination of profile data and a profile‐based climatology. Journal of Geophysical Research: Oceans 109.C12
Simpson, Brown, Matthews and Allen, 1990. Tidal straining, density currents and stirring in the control of estuarine stratification, Estuaries, 13(2), 125-132
Smith, W. H. F., and P. Wessel, 1990. Gridding with continuous curvature splines in tension, Geophysics 55.3: 293-305.
