oceanographer, photographer, artist based in Argyll, Scotland
New paper published: “Observation-based estimates of volume, heat, and freshwater exchanges between the subpolar North Atlantic interior, its boundary currents, and the atmosphere”
This is work we published in Ocean Science in early 2023. While much has been written on the transformation of water north of the OSNAP or RAPID lines, we decided to isolate and investigate the role of the subpolar gyre interior as delineated by the 1000 m isobath, using a boundary dataset comprised of Argo, CTD and EN4 reanalysis data. The circuit was closed across 47 N to the south.
Jones, S.C., Fraser, N.J., Cunningham, S.A., Fox, A.D., Inall, M.E., 2023. Observation-based estimates of volume, heat and freshwater exchanges between the subpolar North Atlantic interior, its boundary currents and the atmosphere. Ocean Science, 19(1), pp.169–192, doi:10.5194/os-19-169-2023.
Abstract
The Atlantic Meridional Overturning Circulation (AMOC) transports heat and salt between the tropical Atlantic and Arctic Oceans. The interior of the North Atlantic Subpolar Gyre (SPG) is responsible for the much of the water mass transformation in the AMOC, and the export of this water to intensified boundary currents is crucial for projecting air-sea interaction onto the strength of the AMOC. However, the magnitude and location of exchange between the SPG and the boundary remains unclear.
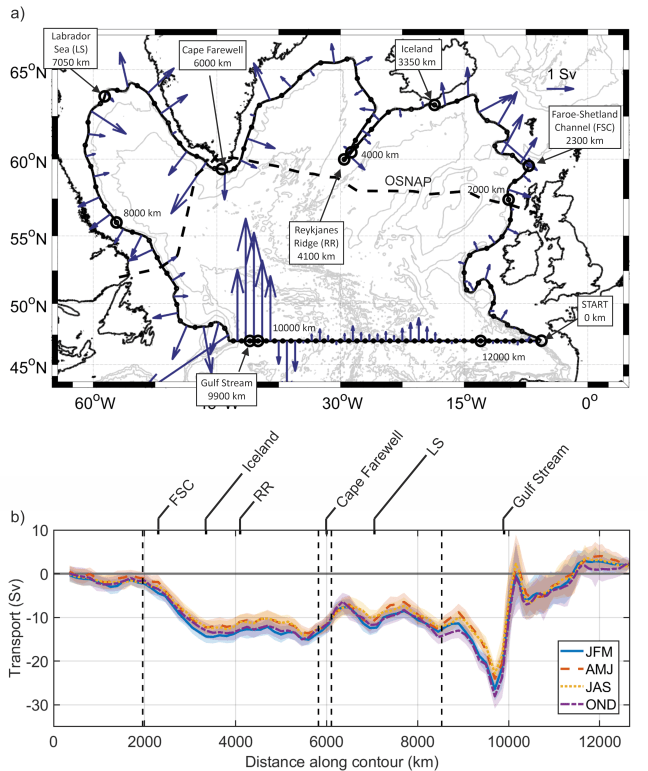
Smoothed 1000 m bathymetry contour (solid black line), closed by transect across 47° N. Key locations around contour are labelled; these are used throughout this study. Dashed black line shows OSNAP line. RT: Rockall Trough, WTR: Wyville Thomson Ridge. Mean magnitude and direction of surface currents (2000-2020) derived from AVISO data shown by coloured contours and quiver arrows. Isobaths overlaid at 1000 m increments. Bathymetry contours from GEBCO bathymetry (http://www.gebco.net/). GEBCO = General Bathymetry Chart of the Oceans.
We present a novel climatology of the SPG boundary using quality controlled CTD and Argo hydrography, defining the SPG interior as the oceanic region bounded by 47° N and the 1000m isobath.
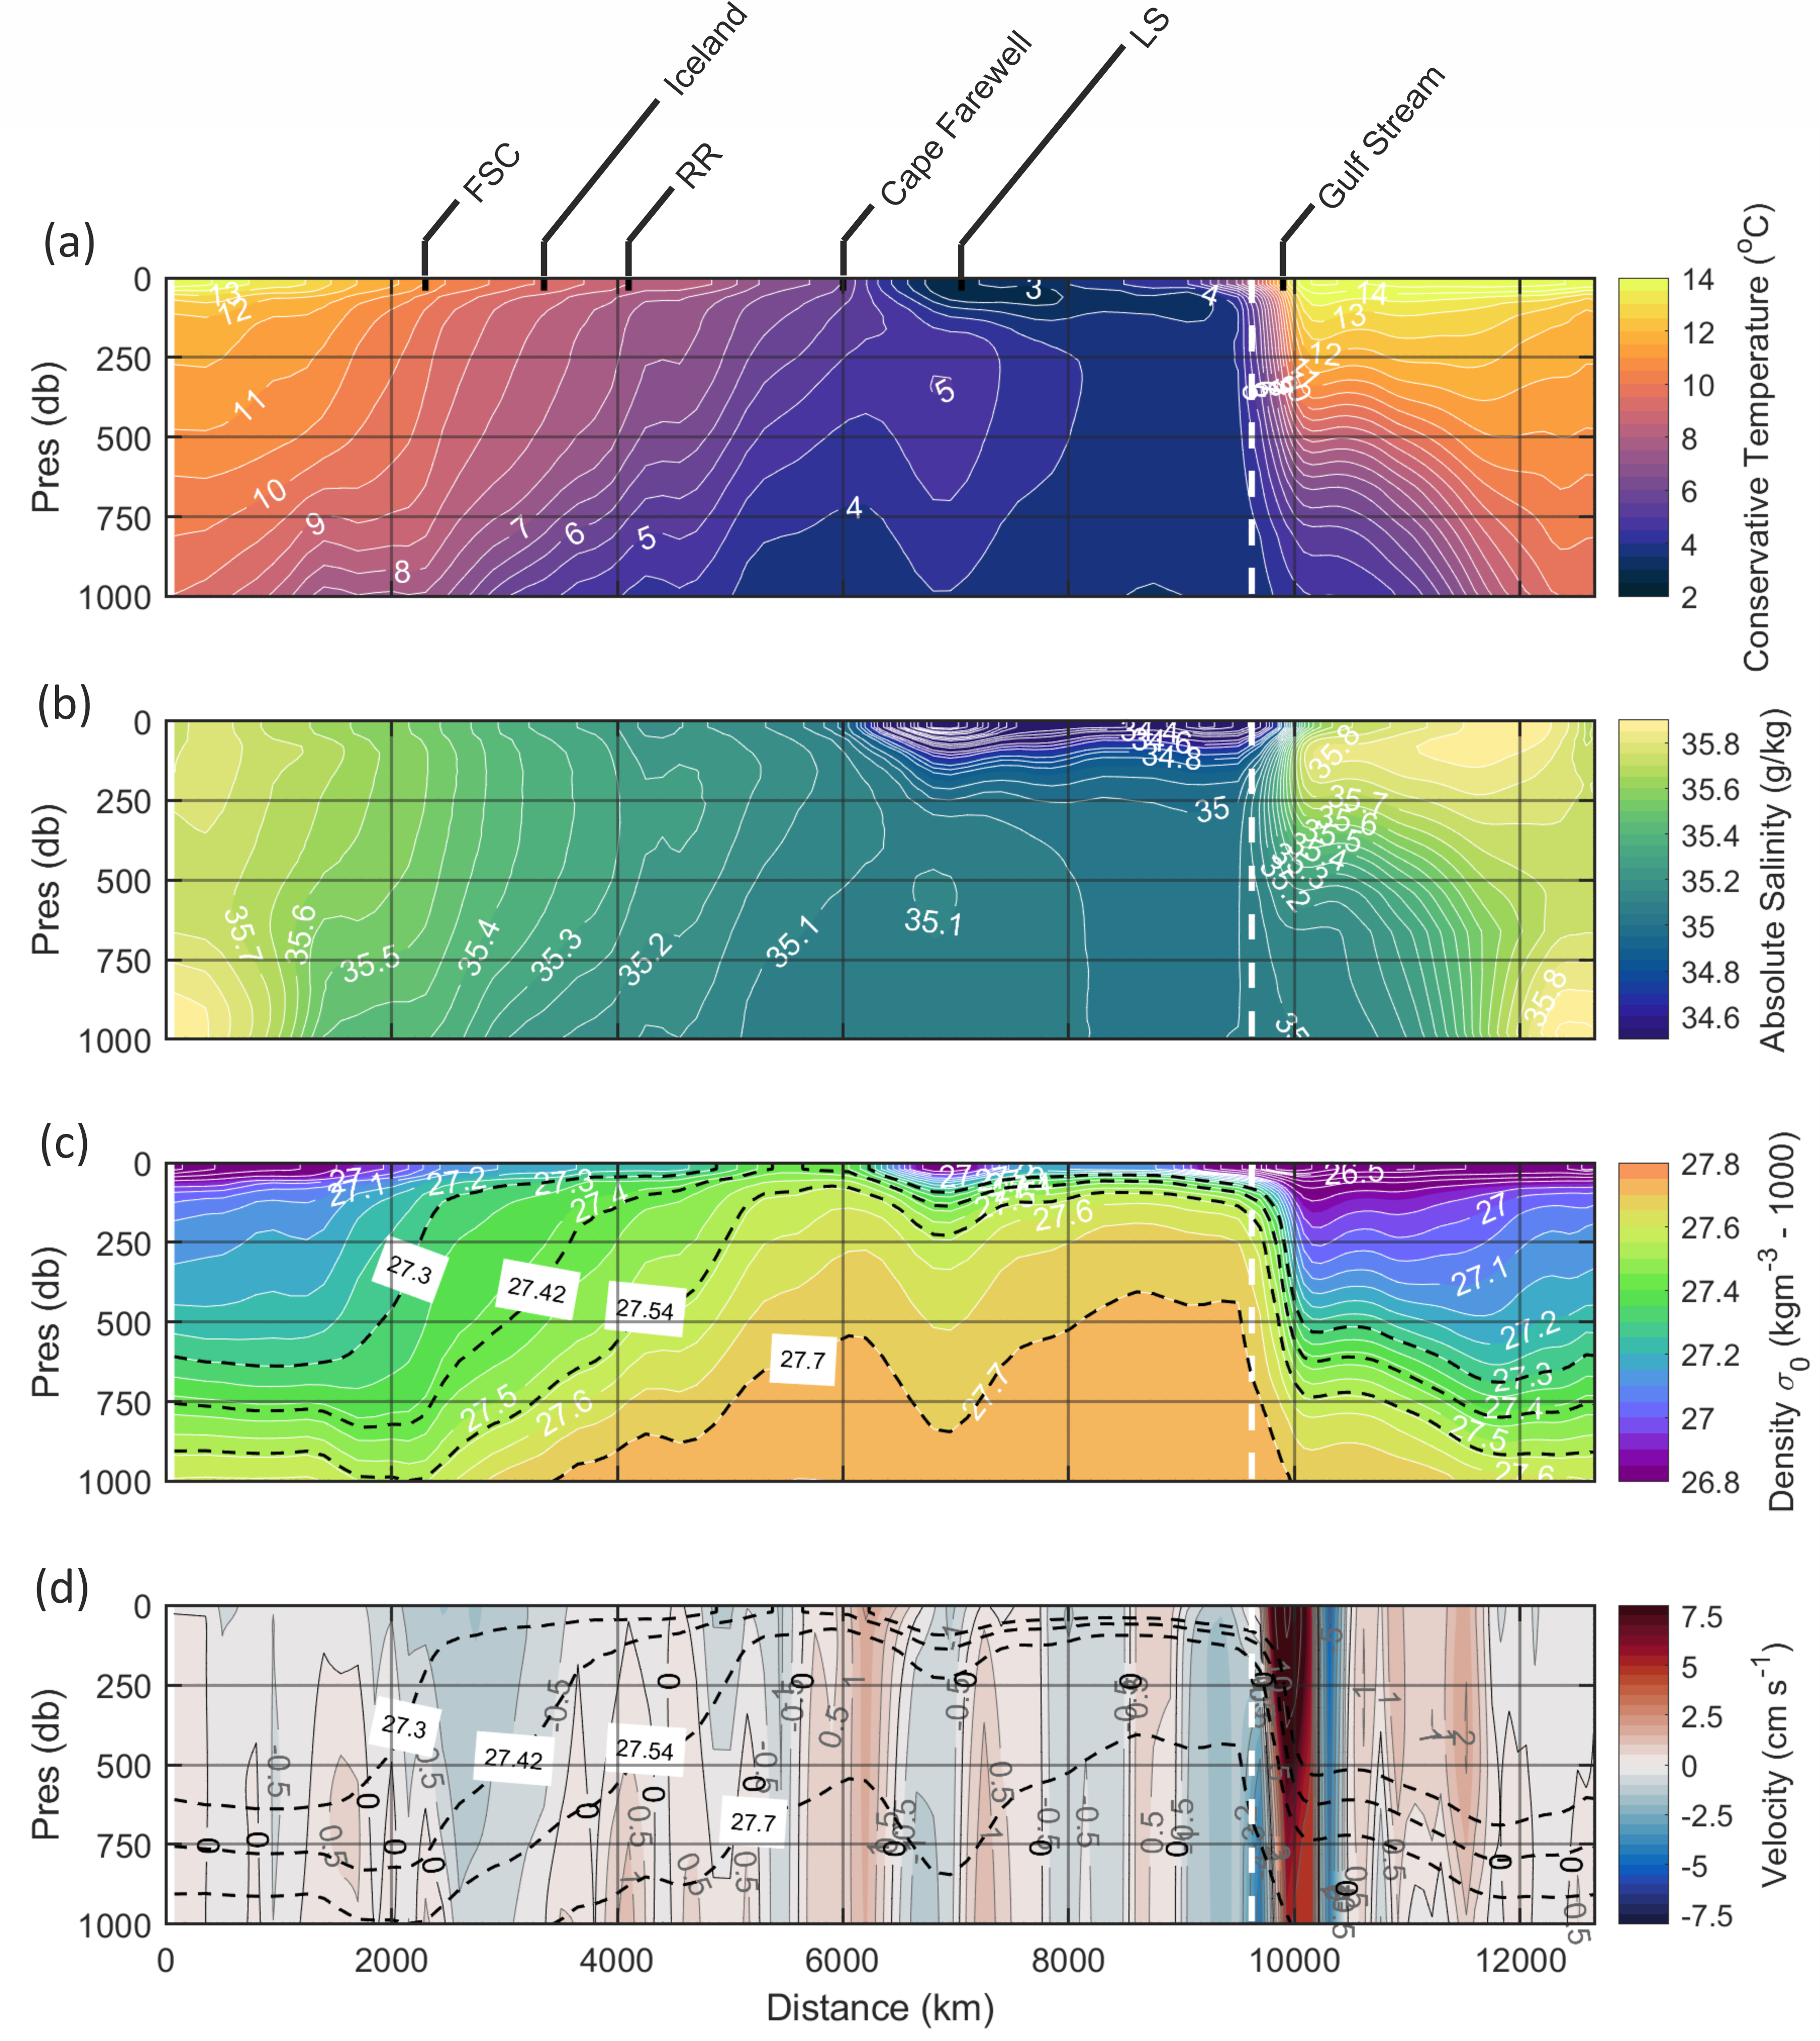
Gridded boundary product plotted by distance along the 1000 m contour travelling anti-clockwise around the basin. Annual means shown. (a) conservative temperature (̊C), (b) absolute salinity (g kg-1), (c) density (σ0, kgm-3), (d) geostrophic velocities across the boundary perpendicular to the 1000 m depth contour (cm s-1, positive into the interior, negative out of the interior, colour map intervals of 0.25 cm s-1 with selected contours shown). Density contours relevant to overturning processes (Fig. 9) shown by black dashed lines in (c) and (d). The transition to the 47° N section, and from gridded CTD to EN4 climatology data, is delineated by the dashed white line. Key locations around boundary labelled. FSC: Faroe-Shetland Channel, southernmost point of Iceland, RR: Reykjanes Ridge (southern tip), Cape Farewell, LS: Labrador Sea, Gulf Stream.
From this hydrography we find geostrophic flow out of the SPG around much of the boundary with minimal seasonality. The horizontal density gradient is reversed around West Greenland, where the geostrophic flow is into the SPG.
Geostrophic transport perpendicular to contour, into the SPG positive. a) Depth integrated volume transport between 0 and 1000 m for each grid cell (timeseries/annual mean). Quiver arrows show magnitude of transport across grid cell, and are constrained to be perpendicular to the section. Horizontal bins are 150 km apart around the 1000 m contour, and 1° across 47° N. Bathymetry contours from GEBCO bathymetry (http://www.gebco.net/). GEBCO = General Bathymetry Chart of the Oceans. (b) Cumulative volume transport around basin, for each season. Key locations around boundary labelled as for Fig. 3, vertical dashed lines denote OSNAP crossings.
Surface Ekman forcing drives net flow out of the SPG in all seasons with pronounced seasonality, varying between 2.45 ± 0.73 Sv in the summer and 7.70 ± 2.90 Sv in the winter. We estimate heat advected into the SPG to be between 0.14 ± 0.05 PW in the winter and 0.23 ± 0.05 PW in the spring, and freshwater advected out of the SPG to be between 0.07 ± 0.02 Sv in the summer and 0.15 ± 0.02 Sv in the autumn. These estimates approximately balance the surface heat and freshwater fluxes over the SPG domain. Overturning in the SPG varies seasonally, with a minimum of 6.20 ± 1.40 Sv in the autumn and a maximum of 10.17 ± 1.91 Sv in the spring, with surface Ekman the most likely mediator of this variability.
(a) Overturning stream function ψ for full SPG boundary in density space between surface and seabed using corrected velocities for sub-1000 m currents. Density of maximum overturning, and that of secondary peak where applicable, highlighted by circles. Densities of mean inflection points marked by horizontal grey dashed lines; these are overlaid on Fig. 3c and d. The hatched area denotes the approximate density space impacted by the sub-1000 m correction velocities. (b) same, but for boundary contour (0-9500 km) only, (c) same, but for 47° N transect (9500 – 12700 km) only.
The density of maximum overturning is at 27.30 kgm-3, with a second, smaller maximum at 27.54 kgm-3. Upper waters (σ0 < 27.30 kgm-3) are transformed in the interior then exported as either intermediate water (27.30-27.54 kgm-3) in the North Atlantic Current (NAC) or as dense water (σ0 > 27.54 kgm-3) exiting to the south. Our results support the present consensus that the formation and pre-conditioning of subpolar Mode Water in the north-eastern Atlantic is a key determinant of AMOC strength.
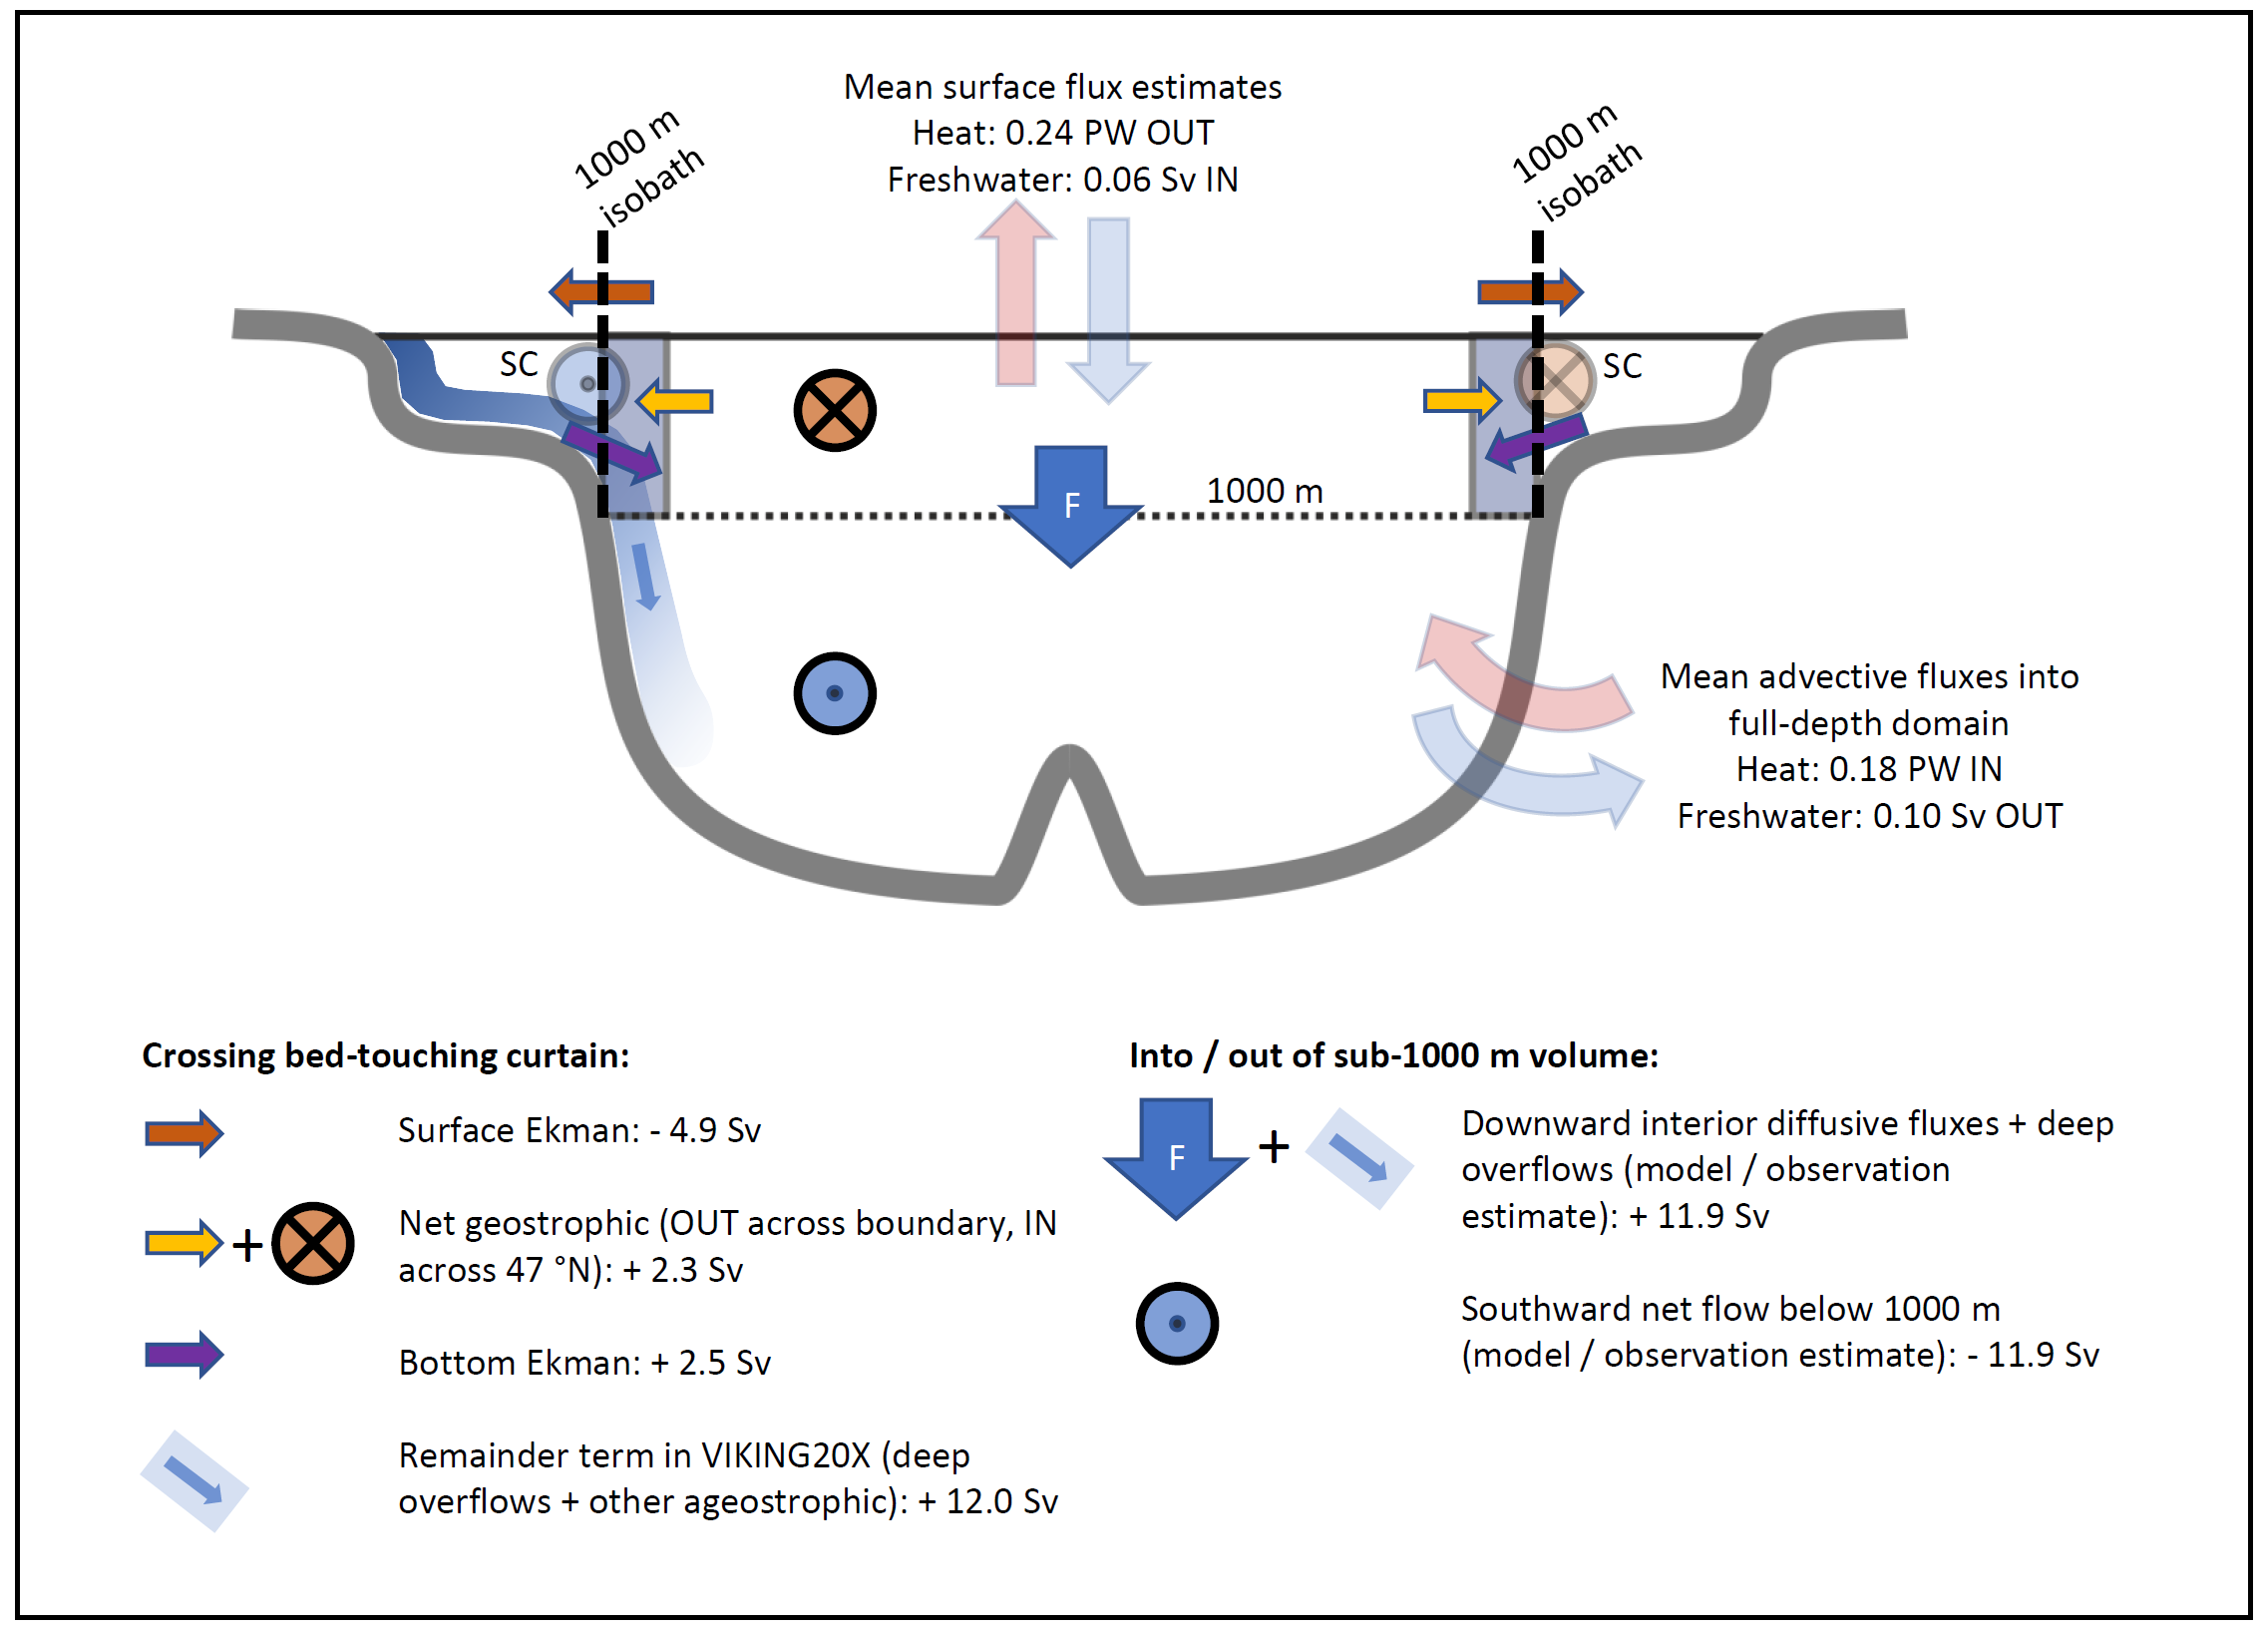
Schematic of SPG boundary and interior processes contributing to transport through the SPG, viewed from 47° N section. The shaded rectangles on either side of the basin represent the regions in which CTD data were gathered. SC: Slope current, Net flow across 47 N above 1000 m is northward (into the SPG) and below 1000 m it is southward (out of the SPG). A net downwelling (F) is required to balance the transports in and out of the SPG.