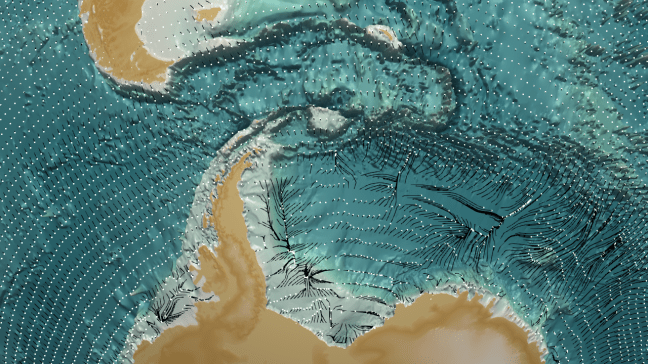
A short animation of modelled species response to observed changes in sea surface temperatures between 1960 and 2009, based on the work of Professor Mike Burrows. The grid of points represents ocean species which are initially evenly distributed. As ocean temperature changes, each point is programmed to change its location to attempt to maintain its 1960 ‘baseline’ temperature – a simplified analogy of how species shift in response to changing conditions.
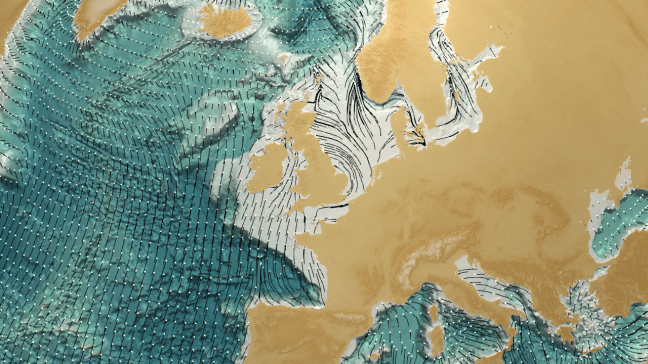
This simple instruction leads to some interesting behaviours – some regions see convergence of species as a geographical bottleneck is reached, others (such as the equator) see divergence as there are is no source region to supply more species. In general, warming in shallow shelf seas has been more rapid than the open ocean, so movement in these regions is greater. Note that the resolution of the model was not as high as the bathymetry depicted here, so some species make some dubious across-land excursions in the animation! Behaviour at the North Pole is also probably not realistic as the presence of sea-ice challenges the model’s assumptions.
This feels like a work in progress as it would be nice to show the underlying modelled temperature data, either overlaid somehow or separately.
See more of Mike’s work here: https://www.sams.ac.uk/people/researchers/burrows-professor-michael/
