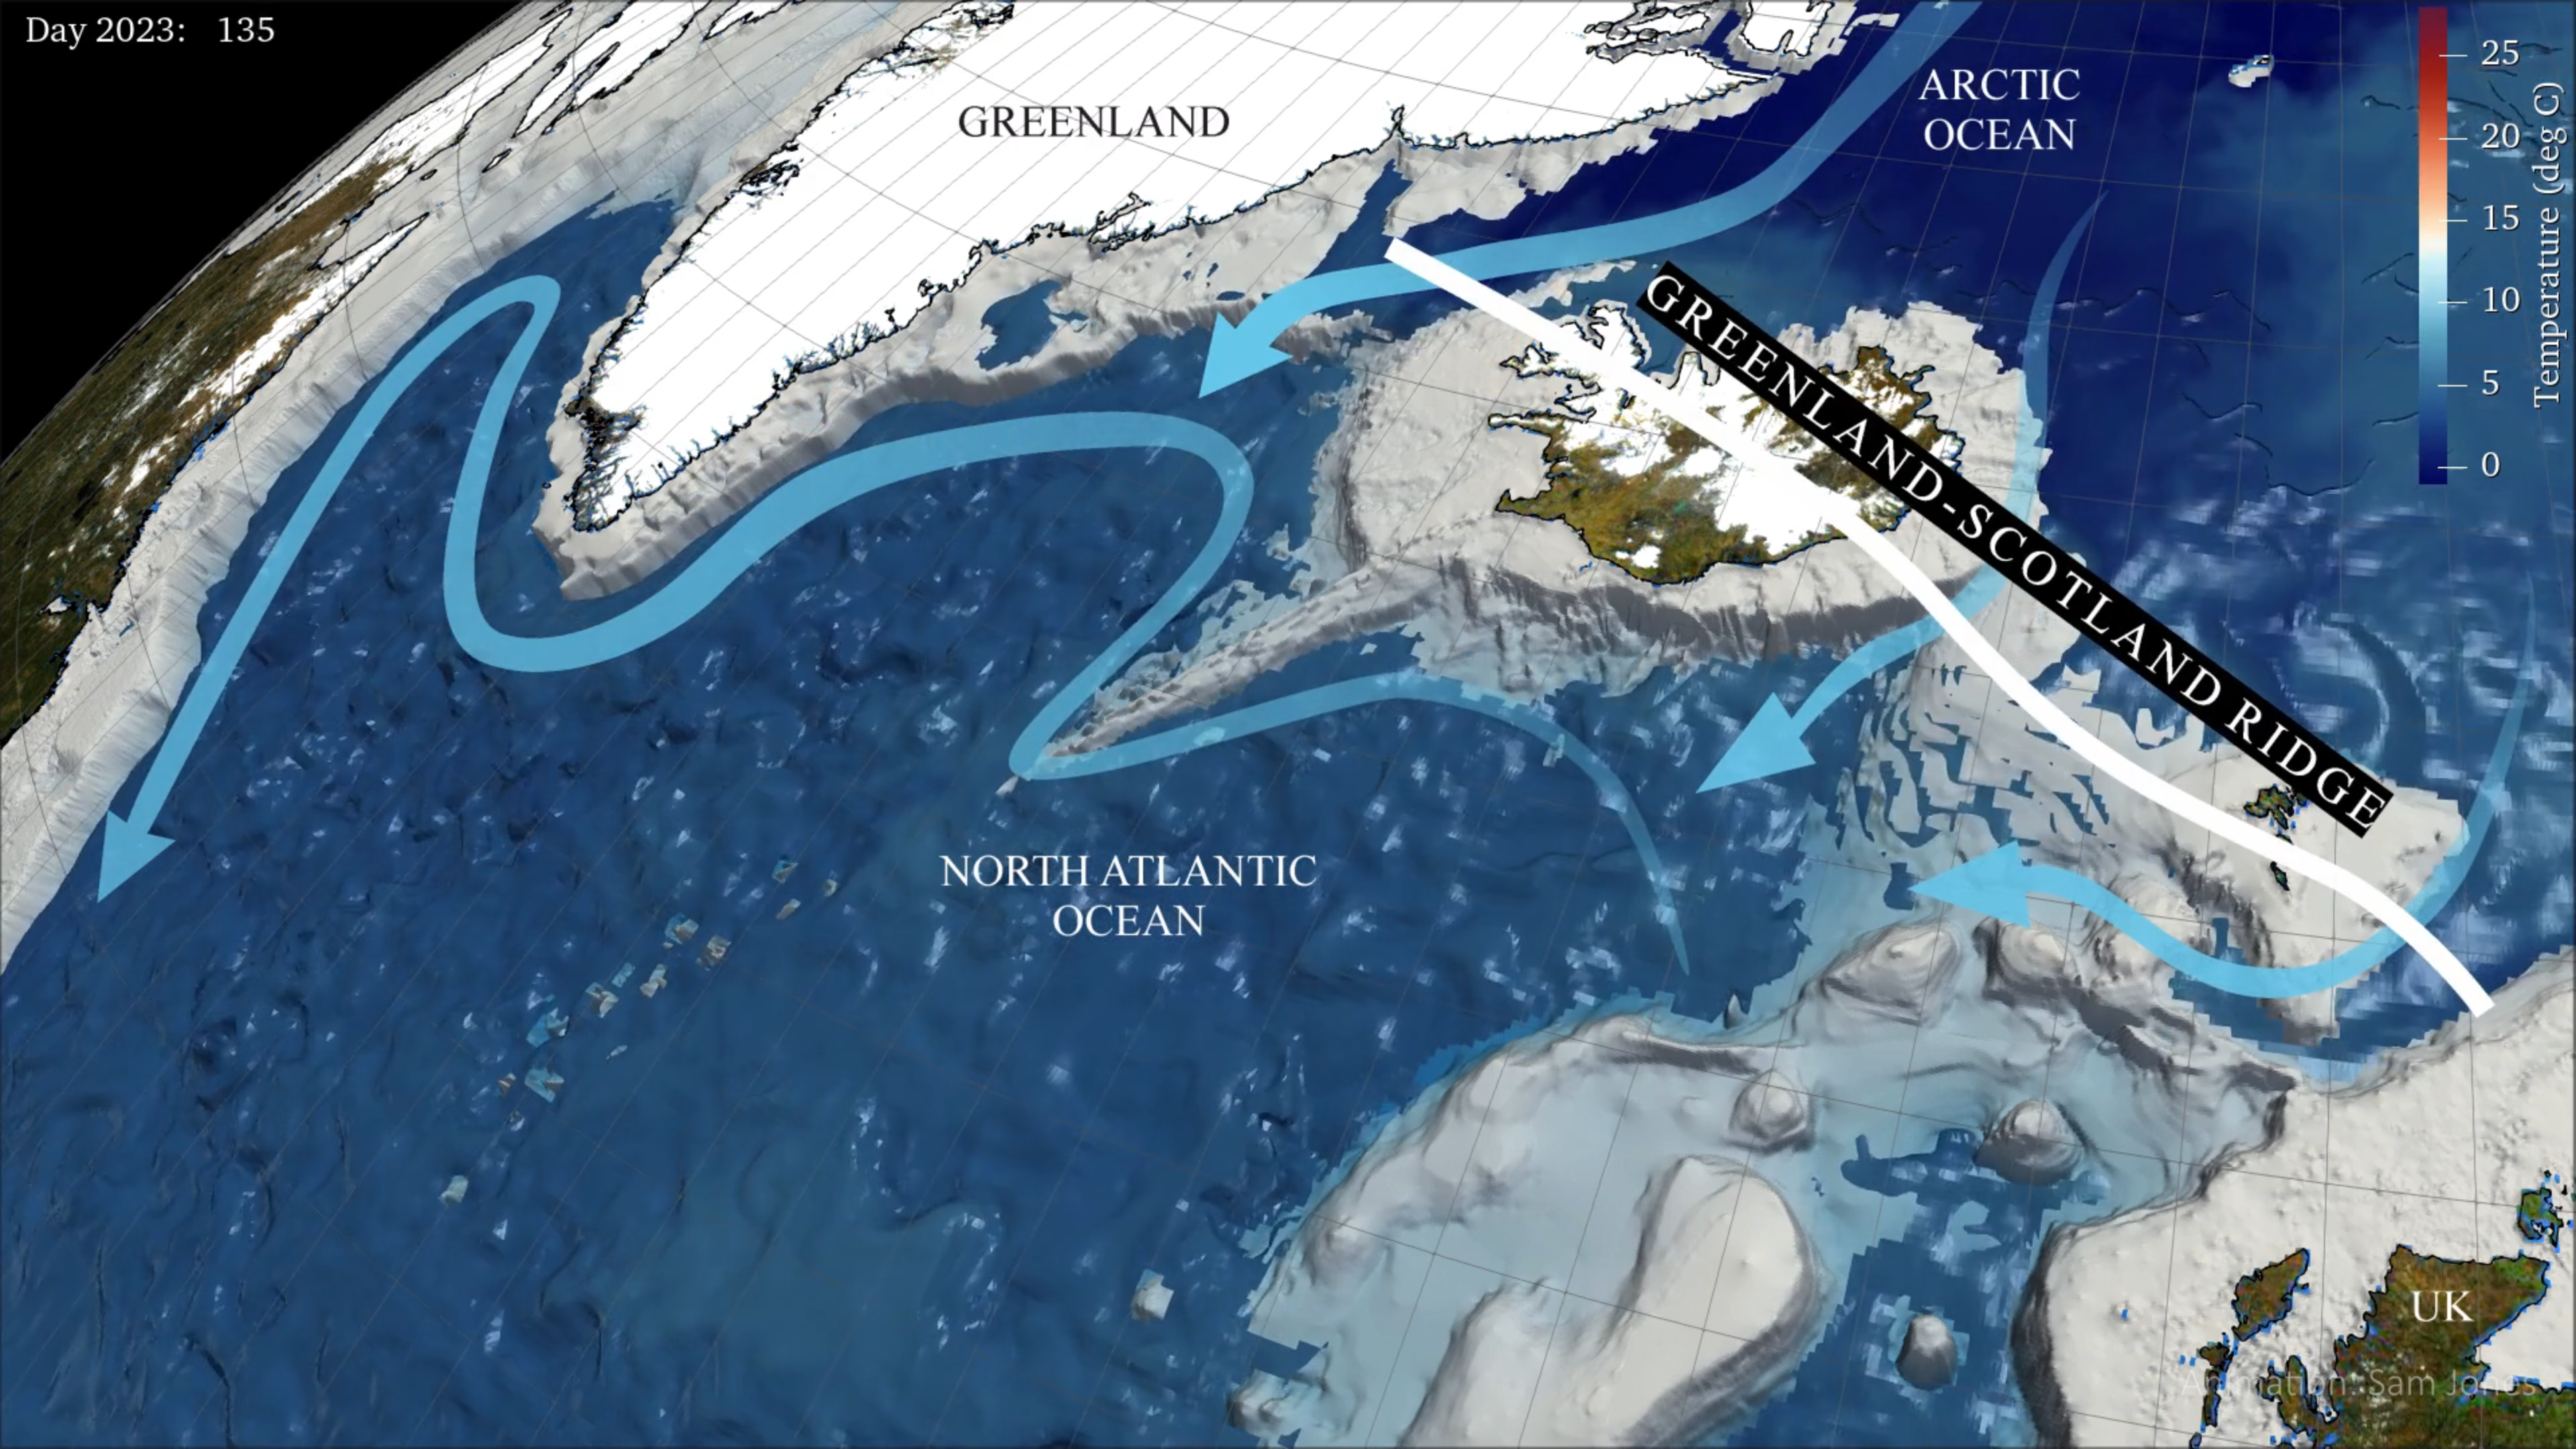
My work in OSNAP is all about the AMOC. This acronym encompasses the entire ‘Gulf Stream / sinking / deep southward flow’ process, but in reality this is a complex system of horizontal and vertical flows, inextricably linked to the weather, in which changes in one place may not register for months or years at another. The result is that the AMOC is an umbrella term which means different things to different people, and is notoriously difficult to explain to a general audience. It has received increasing coverage in the media recently with several high-profile papers forecasting an imminent slow-down or even collapse in its transport. While concern in the stability of the AMOC is well-founded, the long-term observations of transport generated by the OSNAP mooring array do not currently show any trend, and therefore do not generate the same level of media attention. I wanted to present the AMOC from the perspective of OSNAP, give people an overview of the subject but also highlight the complexity that arises from the simple balance of heat and salt in the ocean.
For the animations, the main dataset I used was the 1/12 degree Mercator model from Copernicus. While this is not the highest resolution global model available, 4D model data gets big quickly. I do not have access to a server for running Paraview so this was an exercise in data management and subsetting as much as anything; the aim being to process and render only what is necessary for the narrative.
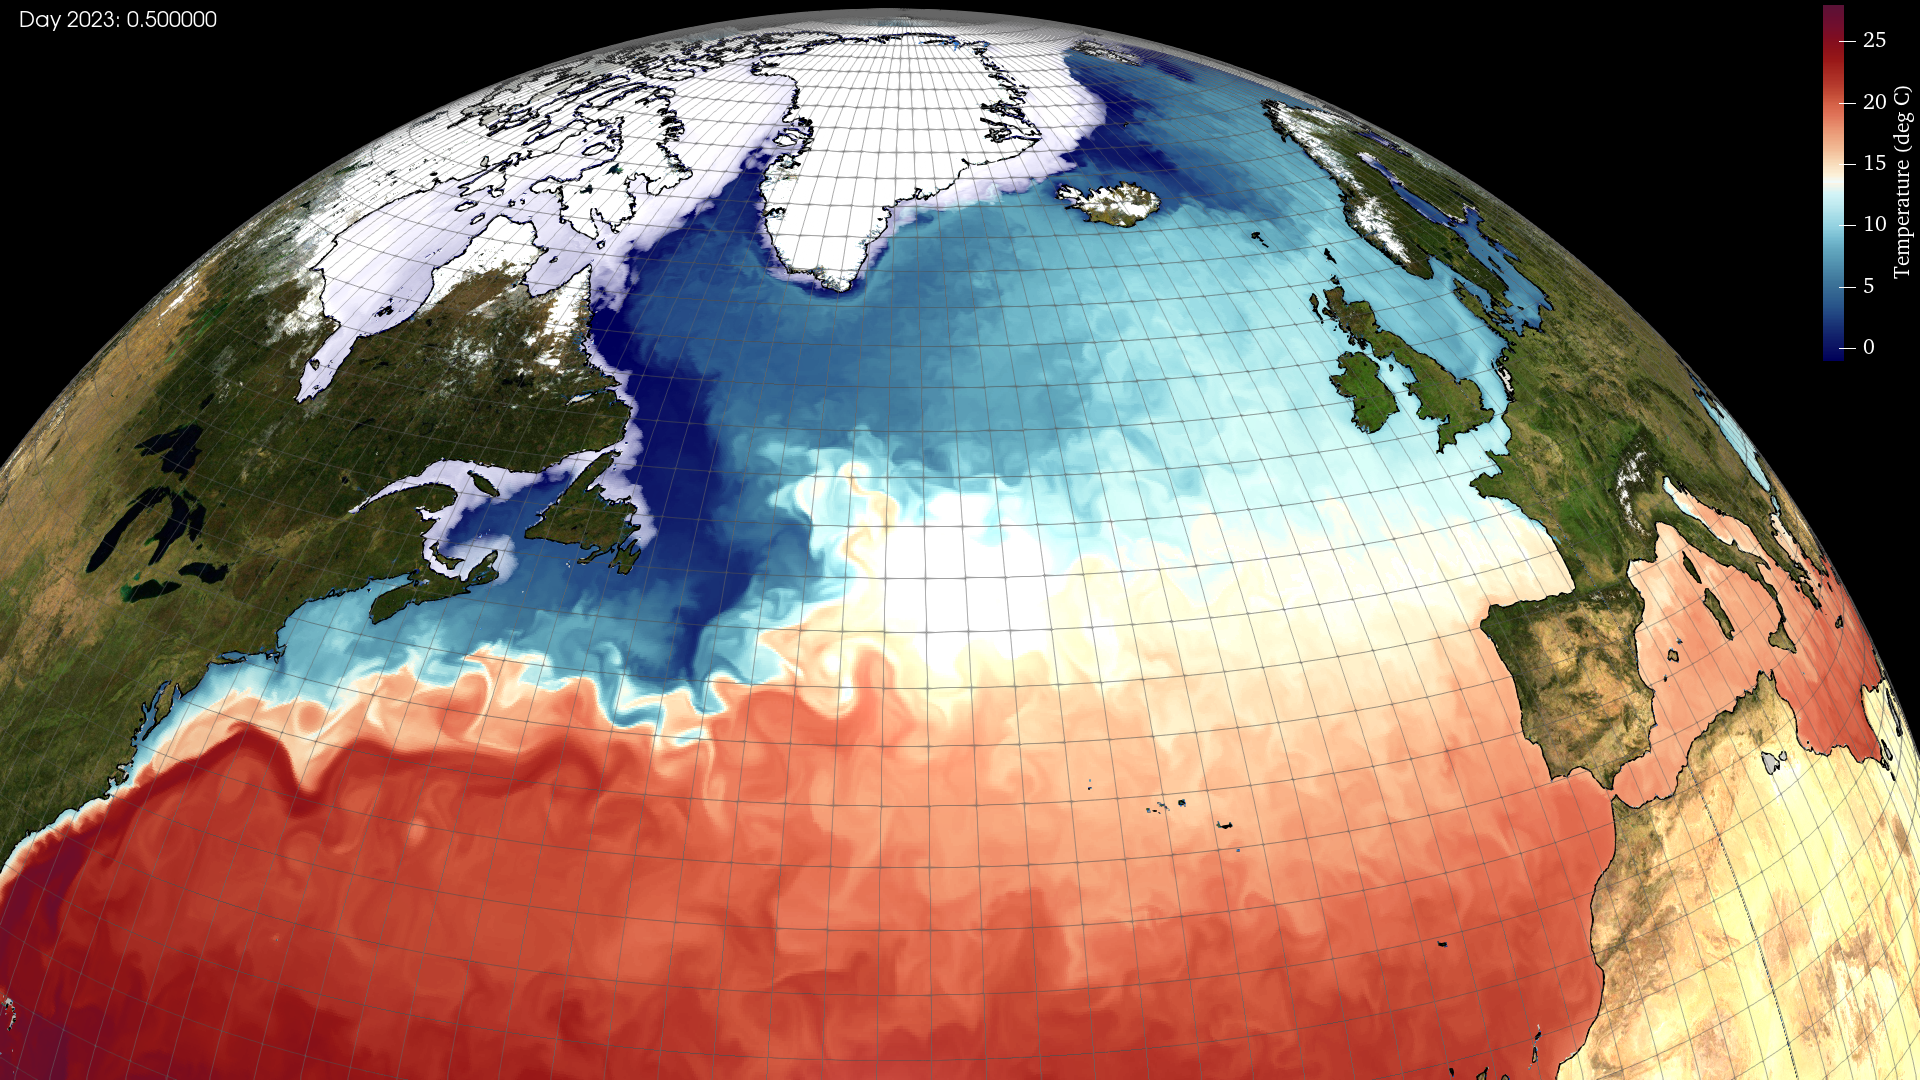
I’ve previously talked about the challenges of rendering 4D model data on a spherical Earth; I’ve since refined the workflow and added the NASA Blue Marble dataset to better represent the land. I use a similar technique to that outlined here, though trim the data at z = 0 m so the land and the ocean are handled separately.

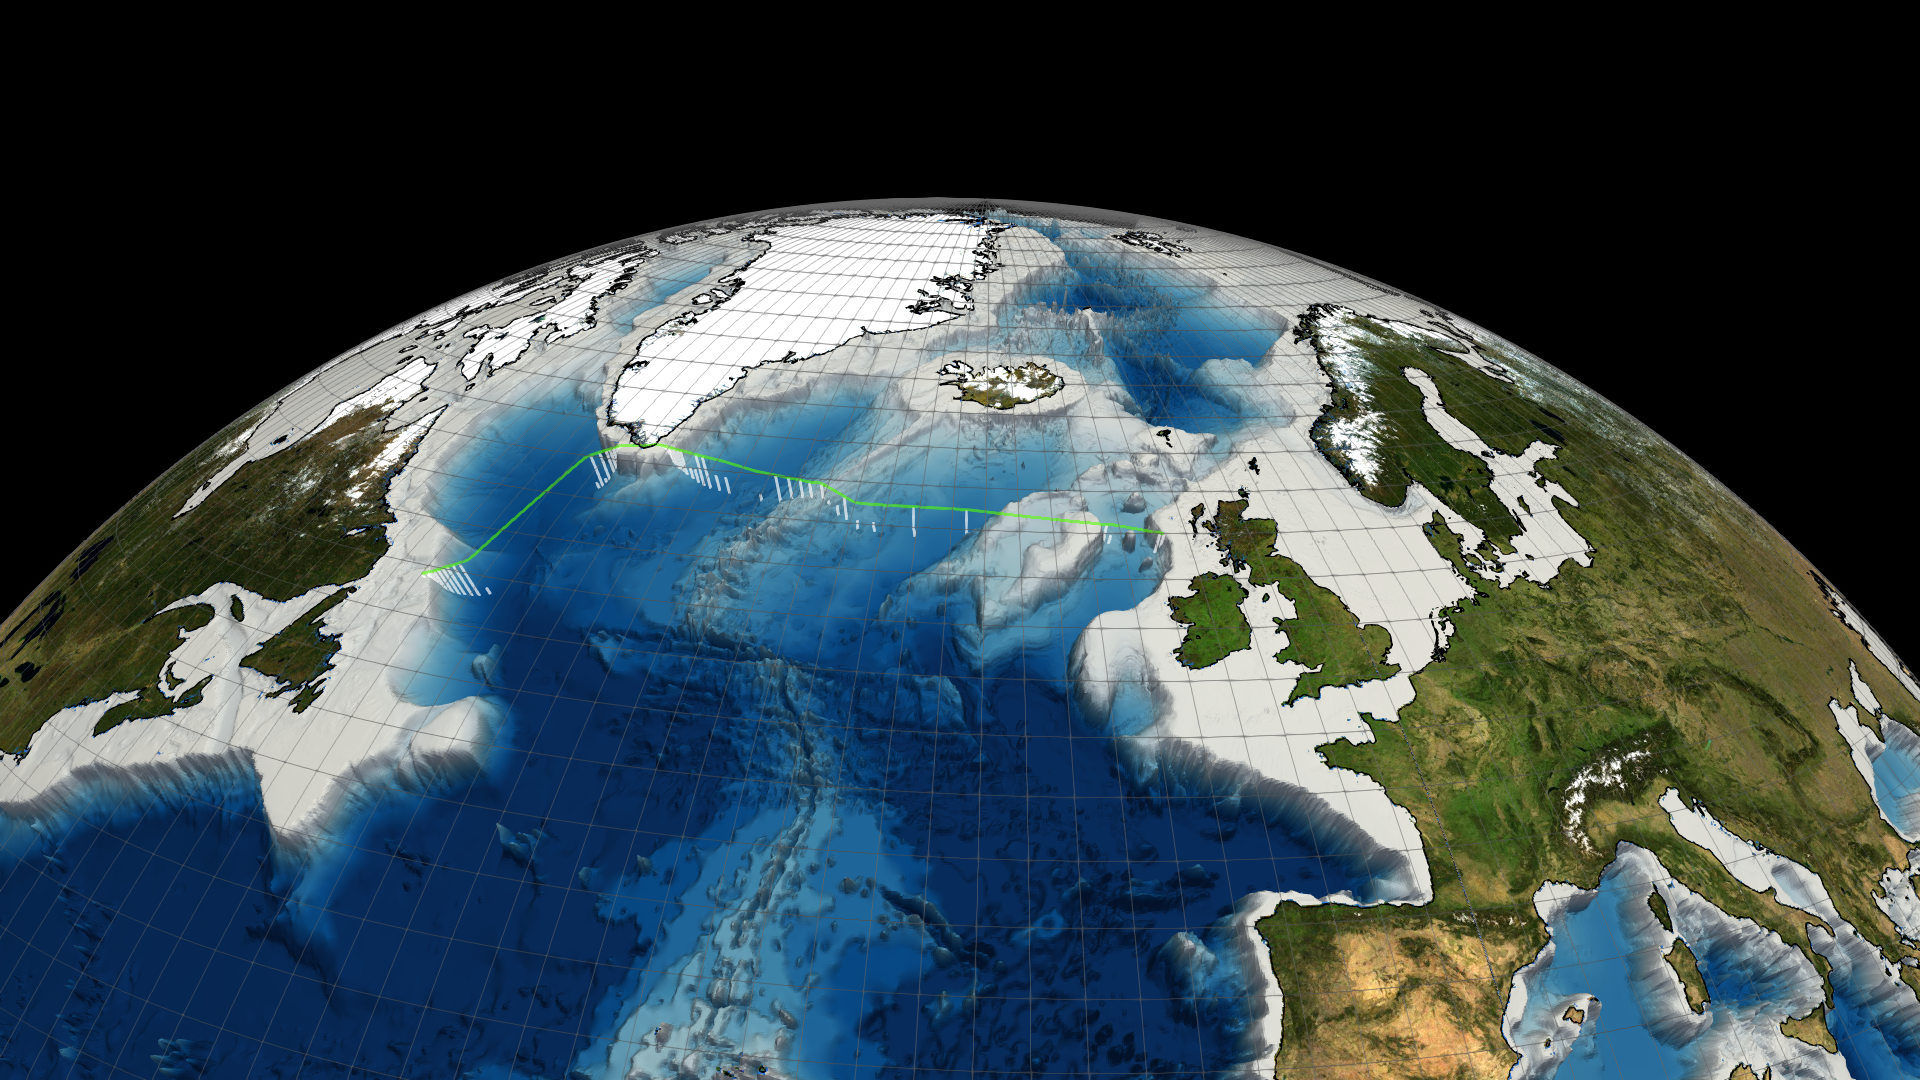
I should just mention the Denmark Strait Overflow scene as I particularly wanted to show this feature of the AMOC lower limb. This feature is quite well represented by the model but did not look particularly visually pleasing in 3D due to the stepped seabed of the Mercator model. I eventually gave in and resampled the model data (using MATLAB) at a much higher resolution for this region only, so while there’s technically no more information, the existing data is presented in a less pixelated form. This sort of crazy workaround is typical of the things you’ll do for Paraview when time and resources are limited but you have a vision…