OSNAPi is a conceptual mooring line connecting the German / Canadian western boundary mooring array with the UK eastern boundary moorings. Rather than traverse via east / west Greenland (as for OSNAP), we aim to calculate the central basin transports using a climatology referenced to surface altimetry. It quickly became apparent that existing climatologies did not adequately resolve major currents so I have been developing an improved one, gridding by distance along the OSNAPi line.
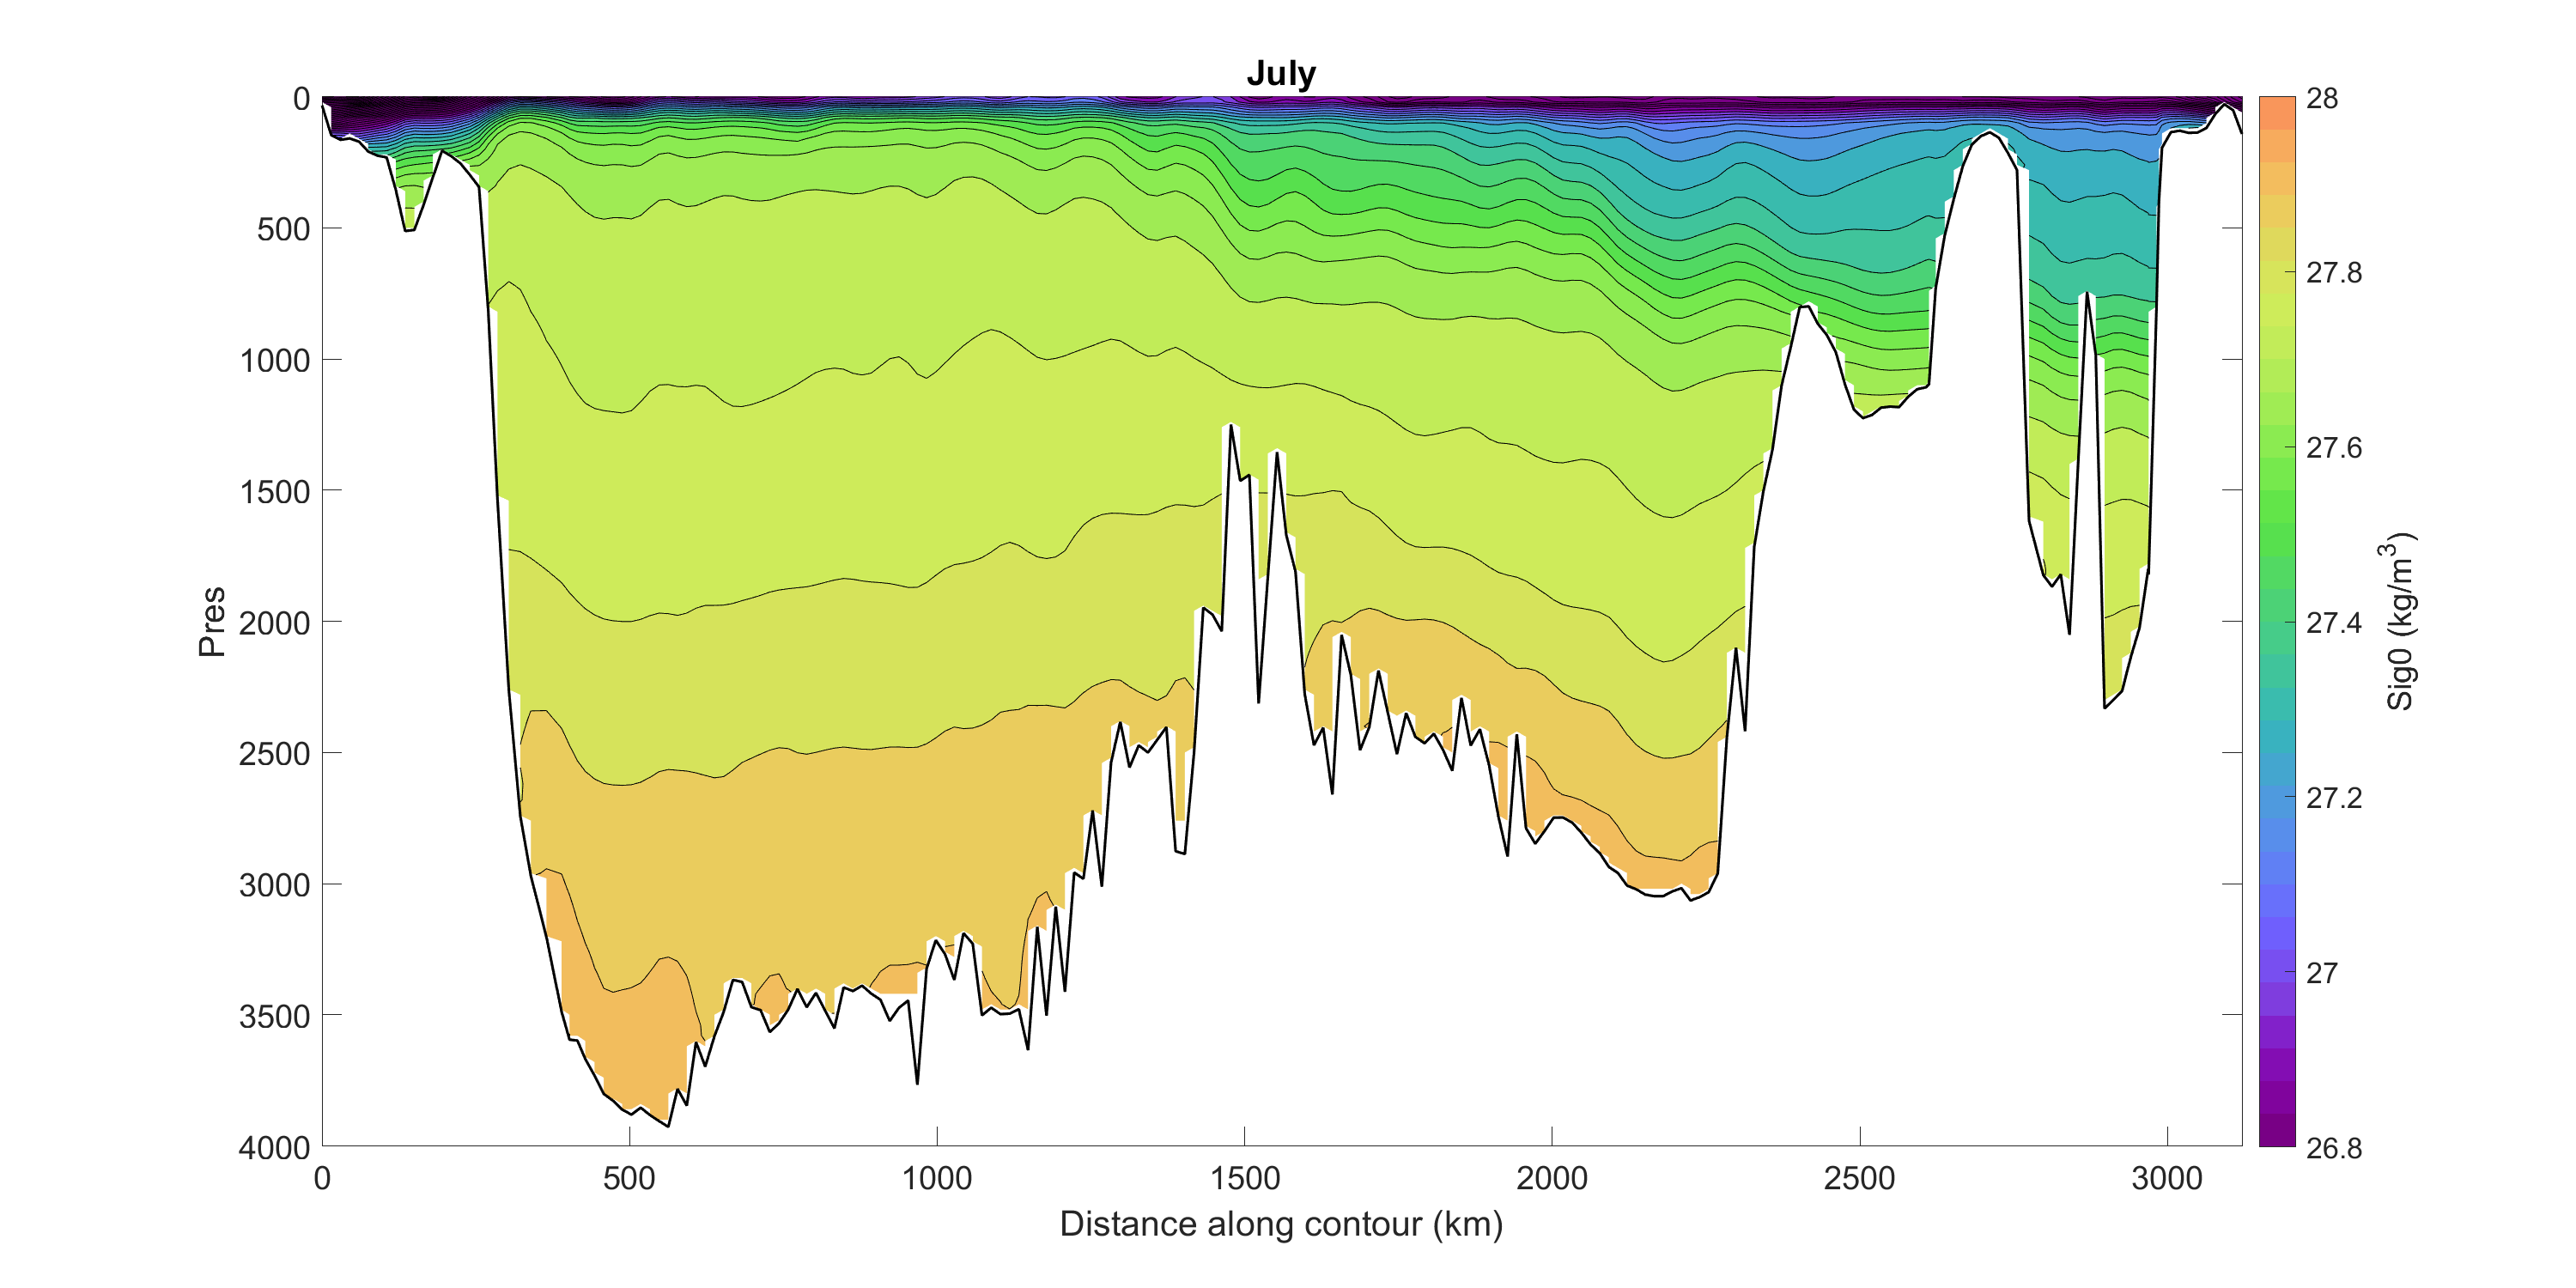
Observations consist mainly of CTD data at the continental margins, and Argo data in the ocean interior. I populate an initial month-mean climatology using an expanding search window, and grid in density space. This ‘average month’ climatology forms the basis for the time-varying climatology, by comparing its T and S properties and vertical gradients to the individual data profiles, and warping in 3D (x-distance, depth, time) to try to minimise error. Finally, the gridded profiles are stabilised using the Gibbs Seawater functions.


We are still in the process of validating the climatology, but initial tests are promising. In particular, it is possible to compare the dynamic height inferred from the gridded water properties to the sea surface height obtained from satellite. Even in sparsely-sampled regions this comparison shows good coherence between the two.

